Every project is incomplete without a report. However, preparing reports for your client or management after hectic days of managing projects is exhausting. With the help of powerful reporting tools, you can make reports with your preferred data and visualization mode.
Take a look at some top tools you can use to create effective and eye-catching reports.
Besides being a project management tool, Asana also lets you create a project report. It introduced the Universal Reporting tool for viewing your work from every possible angle. As a result, you can make data-driven decisions to boost your team’s performance.
This tool works as the one-stop reference for tracking an organization’s progress towards its prime objectives. It streamlines the whole reporting process with the chart template library and other robust features.
No matter how many projects a company manages simultaneously, this tool offers real-time perspectives and actionable insights for all projects. The charts allow you to diagnose and understand the issues and their reasons. Thus, you can take the right actions to fix them.
Wrike comes with a dynamic reporting tool that ensures a 360° visibility of the teams’ tasks.
Its real-time progress tracking enables you to track and share data about team productivity and project progress. You can assess the team output with the reports and take the necessary steps to fix any detected issues.
You can choose from its variety of data visualization options to present the data in a way that works for your team or client.
It also supports analytical widget add-ons, using which you can customize the dashboard for advanced reporting. Thanks to its integration facility, you can fetch data from 50+ digital marketing tools and put them in the report.
Bitrix24 is a free project management reporting tool. You can use this platform to generate detailed reports on team performance, sales data, customer interaction, and various other services. Choose from its reporting templates and customize the fields to make a report.
It saves your time by automating the whole reporting process. Schedule the report with your preferred parameters, and the tool will automatically provide you with the report at the pre-set time. You can also get a daily report of an individual to see their performance graph.
Sharing reports from this tool is also an easy process. You can share the report internally with a click, or export the data in Excel for sharing outside.
Microsoft’s Power BI is a reporting tool for collecting, visualizing, examining, and sharing data. This secured business intelligence app is particularly useful for large enterprises and other expanding organizations. Its end-to-end data encryption keeps your data secure even when you share it outside your organization.
Power BI supports integration with numerous on-premise or cloud data sources, including Microsoft Excel, Salesforce, Google Analytics, GitHub, SQL Server database, Access database, Oracle, QuickBooks Online, SharePoint, Smartsheet, and many more.
Its AI technology helps you analyze data for the report, which allows you to focus on your preferred areas. You can also add interactive visuals to the report to make it attractive.
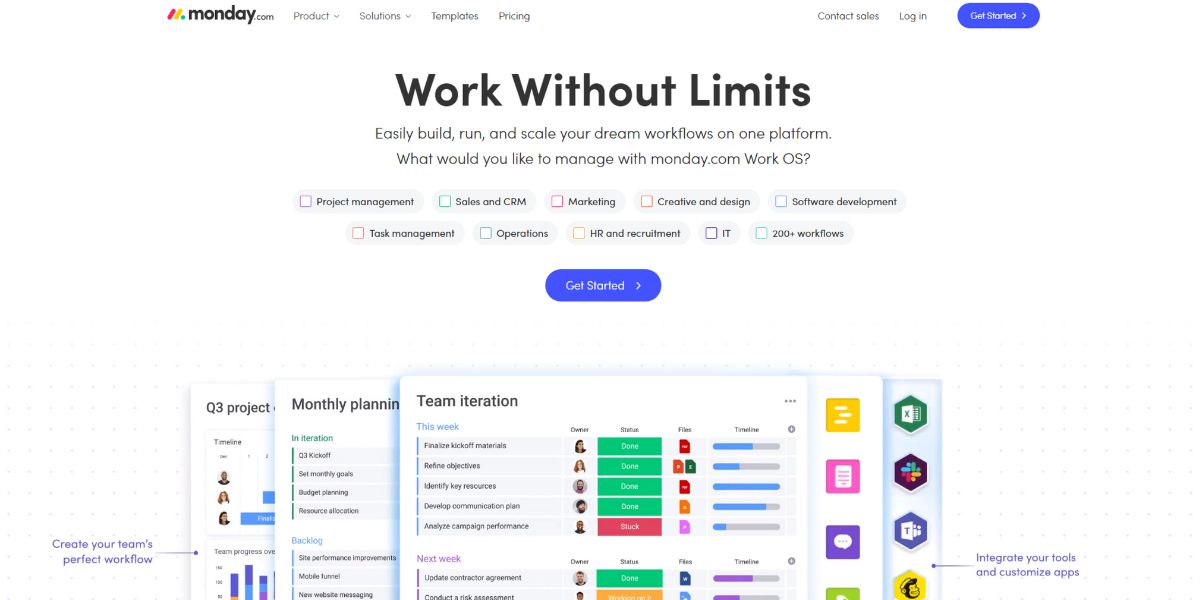
Do you want to impress everyone with a killer project status report? Try monday.com, a reporting tool that lets you generate both basic and advanced reports, depending on your requirements. The reporting tool has a Search Everything bar. It helps you find any data, even from a lengthy and complex report.
With the Chart Views of its dashboard, you can analyze your workflow. You can also use it to pull data from different boards and have them in one place for better decision-making. It’s also possible to use stacked charts to visualize data.
You can use features like Pivot Board, Performance Insights View, textual sentiment identification, and cumulative data addition for advanced reporting.
If you’re looking for a simple yet smart reporting tool, you should go for ProofHub without any hesitation. This online reporting app helps you track your project progress and strategize your next steps accordingly. Through its visual roadmap timeline, you can see all the complete and incomplete milestones of a project in one place.
Besides workflow task reports, it also lets you create individual reports to track task progress, time utilization, and performance of one teammate. You can download the report to share it with others.
You don’t have to be satisfied with the data included in the default report. This tool allows you to choose the parameters to create a customized report that’ll contain the specific data you need.
Tableau is one of the most prominent reporting apps that also offer insights into business intelligence. This globally acclaimed tool efficiently visualizes the data so that you can understand the pattern and predict future outcomes. The platform is a perfect choice for getting accessible analytics and reports.
Besides being user-friendly, it also provides complete security to your mission-critical business data. Use this tool to customize the analytics based on the requirements of your team. These tailor-made reports help you in the process of decision-making.
Some of the other top features of this tool are drag-and-drop, AI-run statistical modeling, scalable cloud-based analytics, and so on.
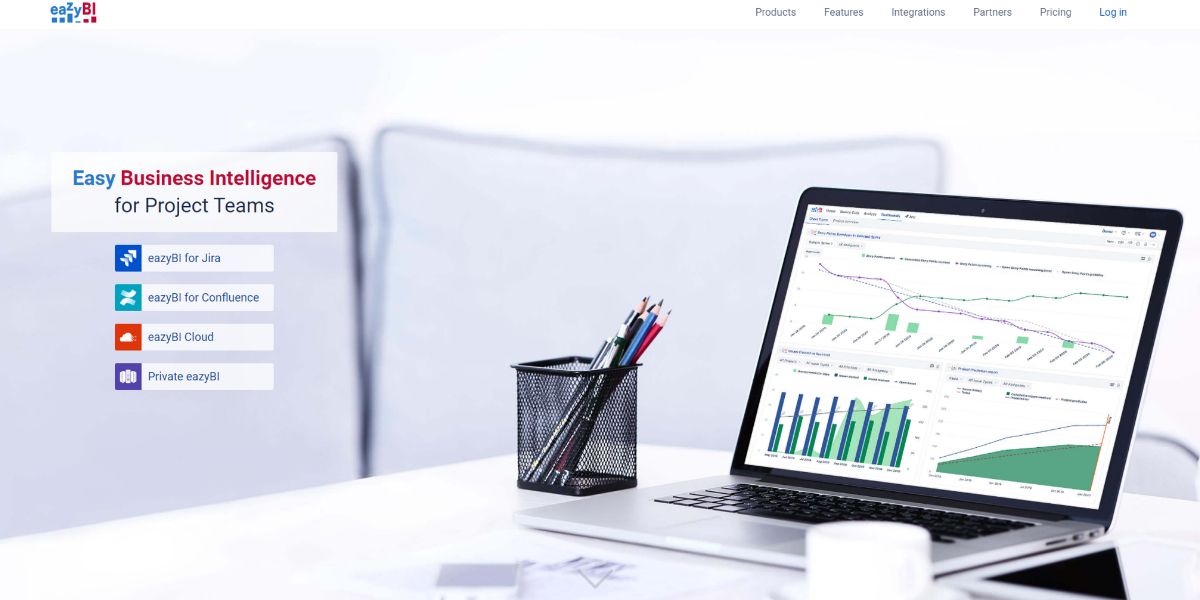
eazyBI lets you prepare reports for data analysis without any need for a complex setup. Using this drag-and-drop report builder, you can easily customize tables, charts, and dashboards for tailor-made reports.
With all your data in front of you, finding various insights becomes hassle-free. Besides the basic analysis, this tool also supports multi-dimensional business data analysis. You can use it for powerful calculations, either by using a predefined calculation or making personalized calculations.
This tool offers various interactive chart types for data visualization including, line chart, pie chart, bar chart, graph chart, mixed chart, gauge chart, Gantt chart, and special timeline chart. You can share the report privately, export its results in Excel or CSV formats, or embed to publish them.
Sophisticated Reports for Better Insights
Reporting is an essential part of a workflow that assists you in data visualization and complex decision-making. To ensure your organization or client gets accurate insight, use any of the reporting tools mentioned above.
It’s also possible that you might want to visualize your reports in a couple of apps and then choose one that suits your style for all projects.


